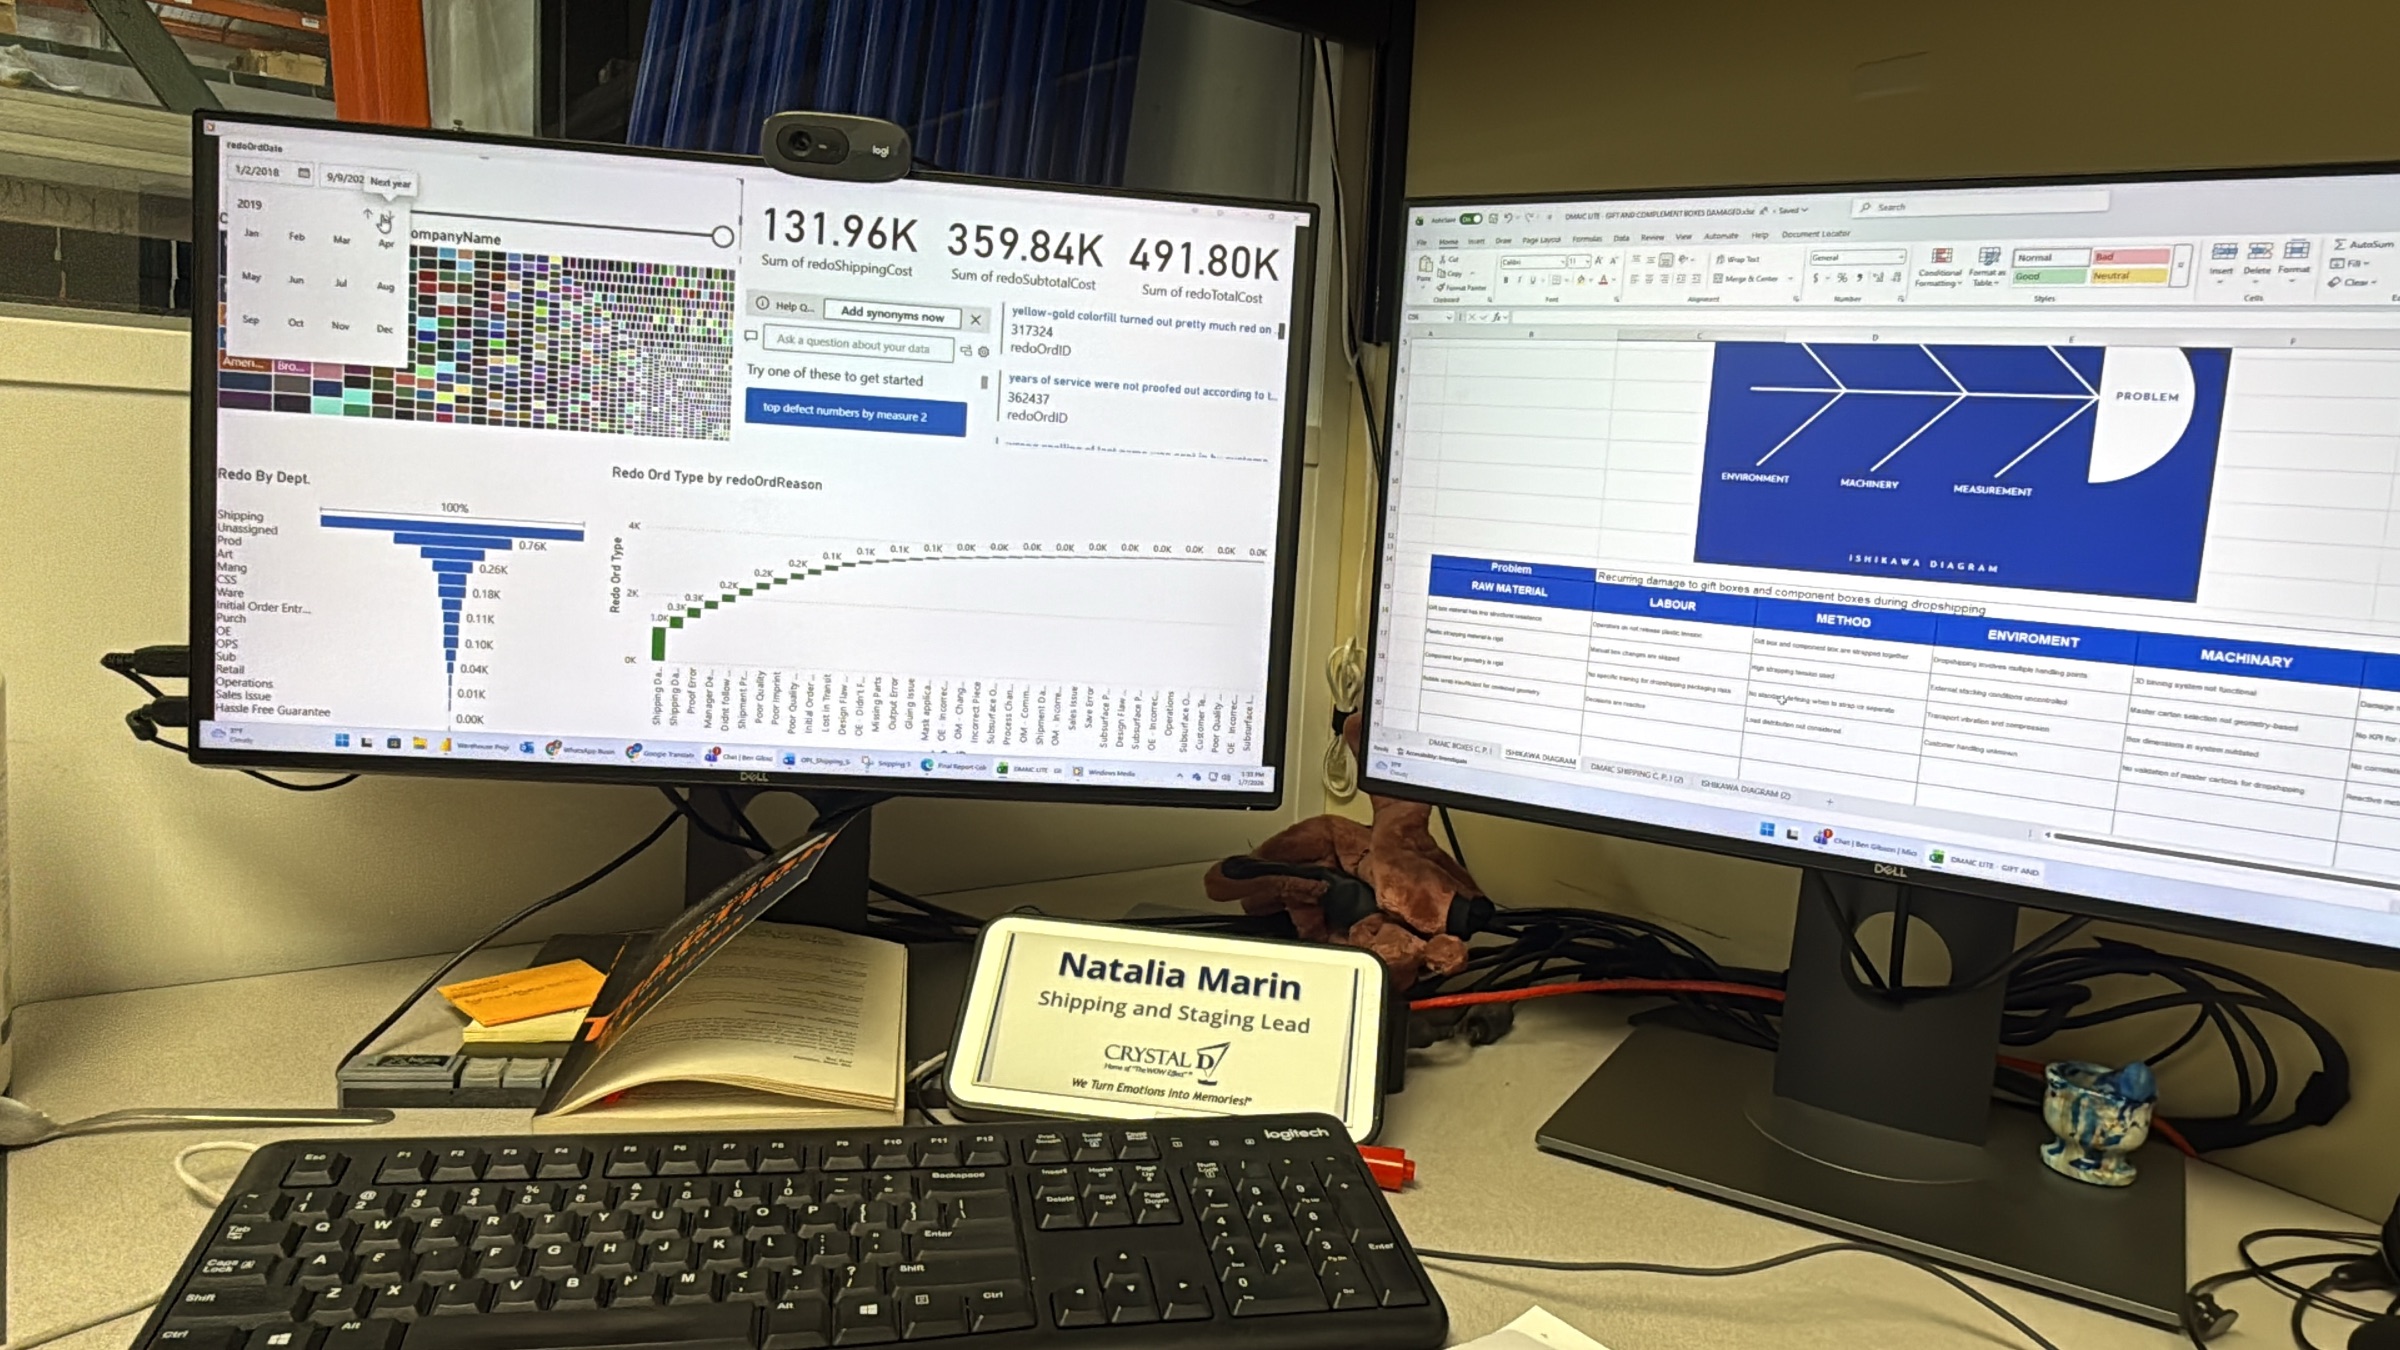
We don't start by building dashboards.
We start by understanding your operation.
What we can help you uncover
Instead of talking about software, we talk about your business.
Our work approach
That same criteria, now turned into four phases that ensure real impact.
Process diagnosis
We map the process with SIPOC and VSM to reveal idle and cycle times, define the problem and critical variables, and review what data already exists in each area. If it's missing, we design the collection plan.
Root cause analysis
Under DMAIC we stratify failures and internal and external claims to isolate the most probable causes behind each KPI gap. Every finding is backed by data.
Unification & automation
We unify each department's databases in Power BI and automate reporting —monthly, quality, and strategic-objective— with paginated reports that generate themselves. Your team stops copying by hand and focuses on analysis.
Executive delivery and interpretation
We present findings with a clear narrative for leadership —what happened, why, what action to take, and how to sustain it— connecting each area's result into a single decision board.
Most companies keep their data scattered: each department with its own base, people copying and documenting by hand, and no one relating how one area's result impacts the rest —when in the end it's a single result. We connect it all and turn it into pure gold.
Applied experience in real operations
We have developed analyses and KPI systems for processes in these domains.
Tap each card to see the criteria
Tools and methodologies
A combination of statistical rigor, process engineering, and data visualization.
Frequently asked questions
Do you know what is really happening in your operation?
Many companies have data. Few convert it into decisions. Tell us what process you want to understand and we will design the highest-impact analysis for your operation.
Legal notice
León & Asociados LLC es una empresa de consultoría profesional registrada en el estado de Minnesota. Ofrecemos dos líneas de solución: (1) preparación de formularios y documentación migratoria, y (2) consultoría en optimización de procesos, análisis de datos, metodología Lean Six Sigma y automatización.
León & Asociados LLC NO es una firma de abogados y ninguno de sus representantes es abogado, ingeniero profesional licenciado (PE), ni asesor legal o financiero.
Las soluciones de preparación migratoria se limitan a la organización y preparación de formularios conforme a las instrucciones oficiales de USCIS; no constituyen asesoría legal de ningún tipo. Las soluciones de consultoría técnica se basan en metodologías de mejora de procesos y análisis de datos; no constituyen práctica profesional de ingeniería regulada.
Para asuntos que requieran representación legal migratoria o soluciones de ingeniería profesional licenciada, León & Asociados LLC recomienda consultar con un abogado de inmigración licenciado o un ingeniero profesional (PE) con licencia activa.
León & Asociados LLC is a professional consulting firm registered in the state of Minnesota. We offer two lines of service: (1) preparation of immigration forms and documentation, and (2) consulting in process optimization, data analysis, Lean Six Sigma methodology, and automation.
León & Asociados LLC is NOT a law firm, and none of its representatives is an attorney, licensed professional engineer (PE), or legal or financial advisor.
Immigration preparation solutions are limited to the organization and preparation of forms in accordance with the official USCIS instructions; they do not constitute legal advice of any kind. Technical consulting solutions are based on process-improvement methodologies and data analysis; they do not constitute the regulated professional practice of engineering.
For matters requiring legal immigration representation or licensed professional engineering solutions, León & Asociados LLC recommends consulting a licensed immigration attorney or a professional engineer (PE) with an active license.
León & Asociados LLC · Professional consulting · Not a law firm or licensed engineering firm · Minnesota, USA